Inspections in any industry have a primary objective: to locate defects in an asset.
Inspectors conducting manual inspections will usually know where a defect is located, because they’re literally standing in front of it when they find it.
But the use of new Remote Visual Inspection tools like the Elios 2 to locate defects bring with it inherent localization issues, due to the lack of indoor positioning systems like GPS. When reviewing video footage you captured with an indoor drone of an asset like a boiler, how do you know exactly where the defect you find is located?
Sometimes the location is obvious, but in some cases it can require a tricky combination of tactics to pinpoint the precise location of a defect.
For example, in order to find the specific location of a defect after collecting visual data with the Elios 2, one inspector told us he often uses a combination of data points, including barometric measurements, maps and blueprints, and reference points found in the video feed—and even with all of this information, getting the location right can still be challenging.
DATA LOCALIZATION = BIG SAVINGS
Figuring out exactly where a defect is located can mean the difference between days or weeks of effort in repairing it.
If you have to enter an asset by cutting a hole into it, digging through dirt, or undertaking some other significant effort, the last thing you want is to get inside only to find out that where you entered wasn’t the right place for performing the work that needs to be done.
Not only can incorrect localization lead to wasted effort, it can also prolong downtimes, leading to huge losses in potential revenue.
Knowing right where a defect is located within an asset can also help companies save money on scaffolding costs, since they can place scaffolding right where it needs to go—and not waste time and money placing it elsewhere.
DATA LOCALIZATION ALSO MEANS HAPPY CUSTOMERS
Not knowing exactly where a defect is can lead to customer frustration.
After an inspection, some customers expect a report showing the precise location of each defect or possible defect within an asset—and feel like they didn’t get what they expected if they don’t get such a report.
[Related read: What Is Simultaneous Localization and Mapping (SLAM)?]
Further, data localization can be a crucial tool for helping various team members communicate and perform their work efficiently.
In an industrial maintenance operation you might have inspectors, maintenance workers, scaffolders, and operators all involved in the maintenance effort. And you might also have managers or C-level people who are interested in the progress of maintenance work, but lack the specific vocabulary or experience needed to fully understand the raw outputs of an inspection.
Data localization can help all of these people understand exactly what is wrong within an asset, and help each of them do their jobs—if an inspector can create a 3D map that shows the location of a defect, they can use it to quickly get all of these different people on the same page.
For example, the scaffolders may not be familiar with the specific plant or asset, but they can look at the indoor map to understand exactly where scaffolding needs to be placed.
Or the operator may want to know what is damaged and where the damage is located, so they can instruct the repair crew to fix the damage. A 3D map can allow the operator to point at an image and make it clear exactly where the work needs to be performed inside the asset.
HOW INSPECTOR 3.0 SOLVES THE DATA LOCALIZATION PROBLEM
For all of the reasons shared above, data localization is a crucial issue for inspectors.
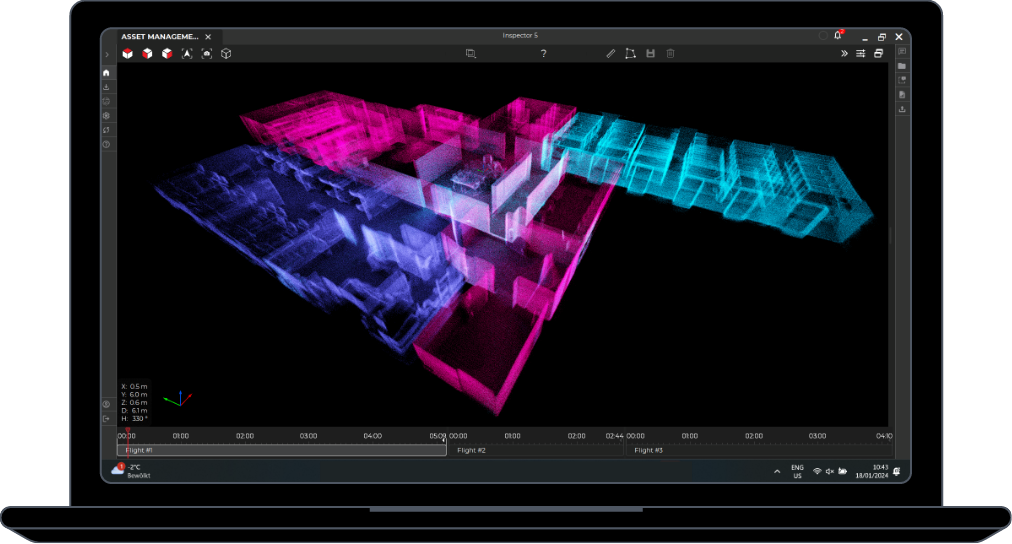
And now our new software, Inspector 3.0, will allow you to localize your data on a 3D map, which you can create right after completing an inspection flight.
Inspector 3.0 is the newest version of Flyability’s Inspector software, made for inspectors using the Elios 2 for indoor inspections.
Key features of Inspector 3.0 are the data localization and mapping one, tools that allows you to pinpoint the location of a defect you find in footage captured while flying the Elios 2 on an inspection mission.
“Often, we may know that there is damage inside an asset, but not know specifically where it is. Inspector 3.0 solves this problem.”
- Simon Kumm, InspecDrone
Inspector 3.0 turns your visual data into a sparse 3D model of the asset you’re inspecting, showing you right where your defects are located within the asset.
Here’s how Inspector 3.0 works:
- You fly your indoor inspection mission with the Elios 2, collecting visual data within the asset.
- As you fly, you identify specific Points of Interest where defects are located and you mark them using the POI button of your remote controller.
- After the mission, you use Inspector 3.0’s mapping feature to create a sparse 3D map of the asset, showing you the location of your Points of Interest (i.e., your defects) inside the asset.
Here are some examples:
But what about processing time? Localization of defects sounds great, but clients may not want to wait until the next day for you to process a 3D map.
Not to worry. Inspector 3.0 can produce a sparse indoor 3D map within about 20 to 50 minutes, so you can have it available to show your client on the same day as the inspection.
Inspectors have reported it being about as easy as turning on their laptop, and voila—they have a visualization of the defects within an asset that they can immediately show to customers.
"Inspector is really what was missing up to now—localized data. It was always requested by my customers. Now I can say, look, the problem is right here."
- Thibault Chatillon, Innovation and Development Manager at Setec
Want to localize your inspection data? Learn more about Inspector 3.0.