How Accurate Are The 3D Models You Can Make With FlyAware?
Over the last few years, LiDAR data has quickly become one of the most reliable foundations for creating precise and accurate 3D models.
Sectors like mining, construction, and infrastructure are using these models to conduct routine inspections, make safety determinations, track the change of assets over time, and support project planning.
The types of outputs professionals in these industries are getting from 3D models made with LiDAR data include detailed digital twins, accurate 2D and 3D measurements, the ability to pinpoint the locations of defects within assets, the ability to export data to common 3D point cloud file extensions like *.e57, *.las, *.laz, and *.ply, and the ability to merge multiple georeferenced 3D models to track changes in assets over time.
Regardless of the industry or output, the quality of the model is key to its usefulness. If the data is not accurate— a term that has a specific definition in 3D modeling, which will be covered in a separate section below—then it may not represent the real world well enough to offer valuable insights.
This article covers findings from tests performed by experts at FARO (formerly GeoSLAM) and the Flyability product team that highlight the differences between models processed using FlyAware and FARO Connect.
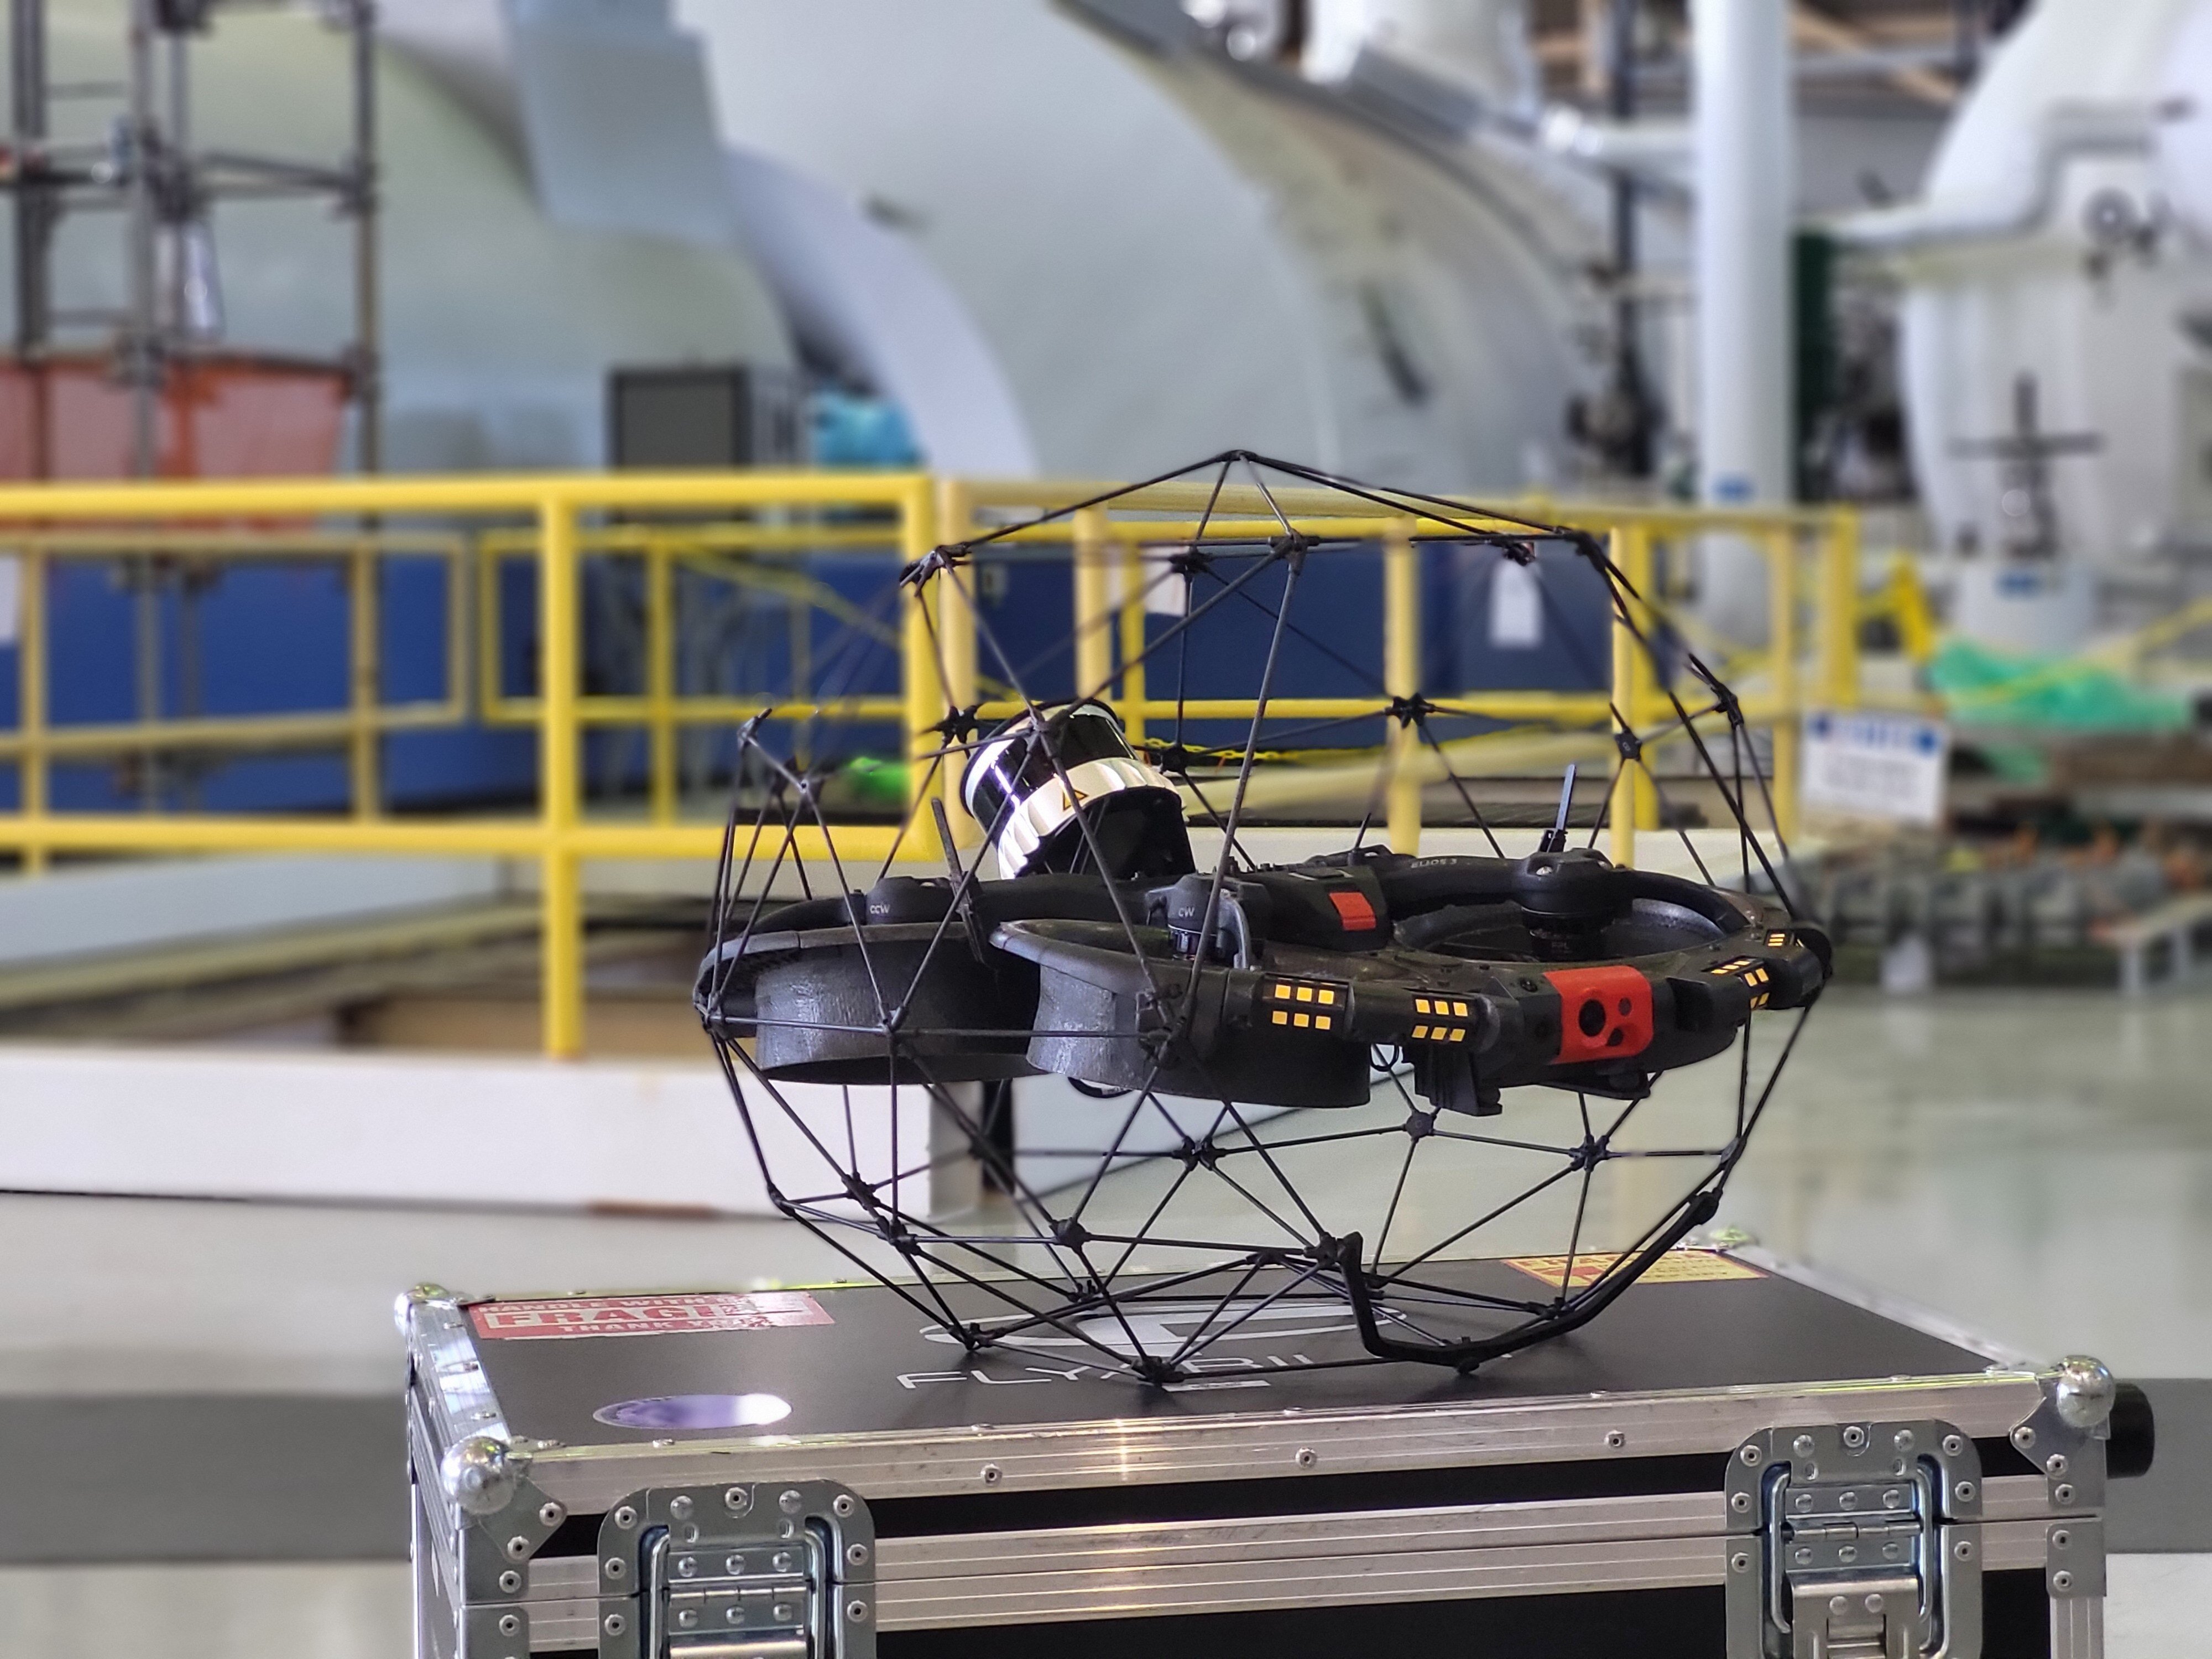
About the Elios 3's LiDAR Payload
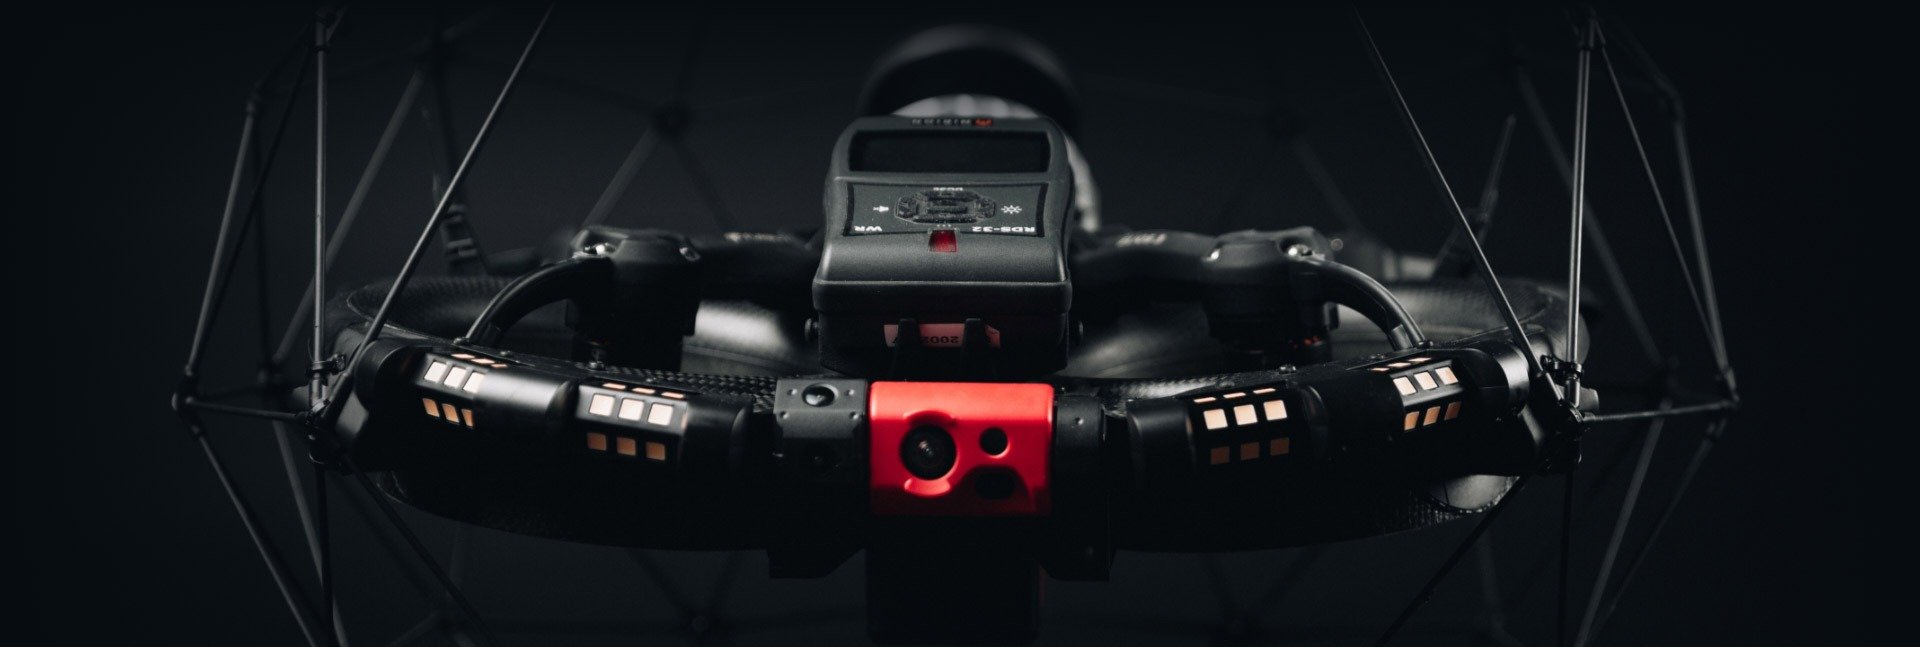
Flyability’s Elios 3 comes with Ouster’s OS0-128 Rev 7 LiDAR sensor and the ability to perform SLAM (simultaneous localization and mapping), which means that it can create 3D models in real time, while in flight. You can learn more about this LiDAR sensor under our Surveying Payload.
After the flight, Elios 3 users can process the LiDAR data they collected with FARO Connect to create precise, accurate 3D models.
The 3D Live Model and the post-processed model have distinct uses, and should not be seen as the same kinds of 3D models. While the 3D Live Model can be used during a mission for navigation, route planning, and verifying scan coverage, the post-processed model you make with FARO Connect can provide an accurate point cloud.
Defining Our Terms: Global Accuracy, Georeferenced Accuracy, and Drift in 3D Mapping
Global accuracy in 3D modeling relates to the distance between two points in a point cloud, where the object cannot be viewed from a single position (e.g., the distance between two rooms).
Georeferenced accuracy is global accuracy plus inaccuracies caused by the alignment method. Examples of alignment methods include target-based registration and Iterative Closest Point (ICP).
Drift is a term used in 3D modeling to describe the cumulative decrease in accuracy over the duration of a capture. Accuracy cannot easily be expressed in absolute values (e.g., +-2cm/.79 in) because, in the absence of ground control points or GNSS, the absolute error usually grows along with the size of the asset or the distance that is measured.
For example, the error on a 30m (98.4 feet) measurement is likely to be smaller than the error on a 300m (984 feet) distance measurement because a mobile scanner moving through an asset will accumulate errors on top of previous errors the longer it travels and records data. This accumulation of errors over distance is described by the word drift, representing a percentage of the traveled distance during data collection—for example, a 1% drift on a 300m (984 feet) distance corresponds to a 3m (9.84 feet) error as compared to reality.
Global Accuracy and Georeferenced Accuracy Assessments with the Elios 3
To compare and evaluate the global accuracy and georeferenced accuracy of the Elios 3’s point clouds, identical captures were processed using both FlyAware and FARO Connect. FARO 3D mapping experts and the Flyability product team carried out tests within an industrial factory.
Establishing a Control
When assessing the accuracy of any system, a second measurement system must be used to provide the benchmark value (i.e., the control) and this system must be of greater accuracy than the system being tested.
To test the accuracy of a mobile mapping solution like the Elios 3, the industry standard is to use either a Total Station (TPS) or a Terrestrial Laser Scanner (TLS) as a control, because the accuracy for both of these approaches exceeds that of a mobile mapping solution.
The reason the TPS and TLS approaches obtain greater accuracy than a mobile mapping solution is because they each capture data from a single, stationary position, with multiple positions registered together using point matching algorithms.
In comparison, a mobile mapping solution like the Elios 3 moves continuously as it collects data, capturing data at multiple positions as the drone moves through the environment it is mapping.
The global accuracy and georeferenced accuracy tests we performed relied on data collected by a Terrestrial Laser Scanner (TLS) as their control. It is to be noted that the control took more than six hours of time to acquire the data, due to the size of the asset. In comparison, the Elios 3 took 8.5 minutes to acquire the data.
Test Environment
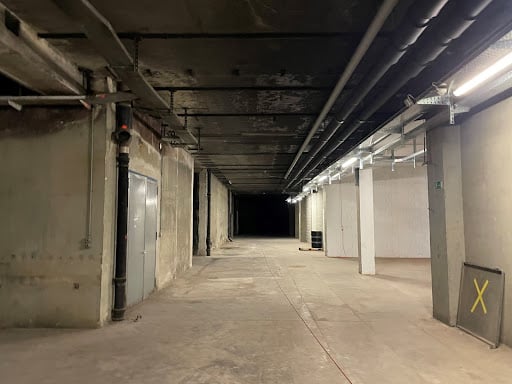
To evaluate the global accuracy and georeferenced accuracy of the Elios 3’s point clouds processed with GeoSLAM Connect, the LiDAR data was captured in a factory named the Blue Factory, located in Fribourg, Switzerland.
The factory consists of 12 rooms of varying sizes separated by several doorways, presenting a representative industrial environment suitable for the Elios 3.
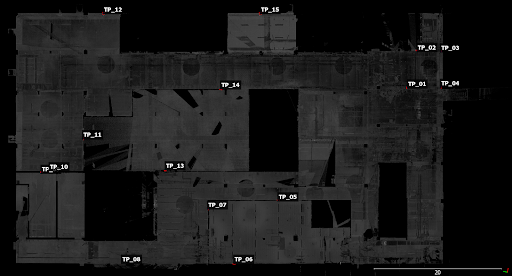
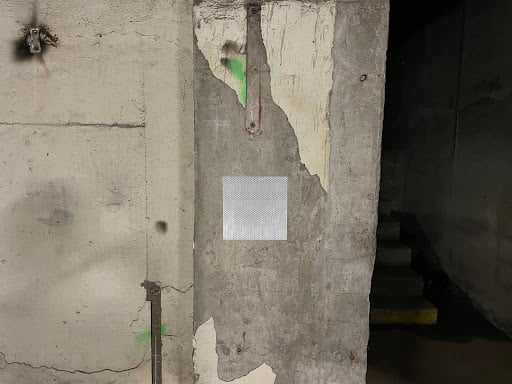
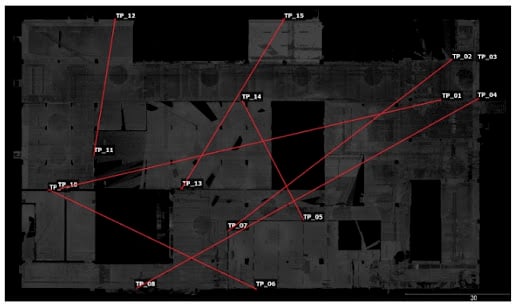
15x Retroreflective Diamond Grade 3M (9.84 feet) targets (200mm x 200mm / 7.87 in x 7.87 in) were placed evenly around the test environment, as shown in the next two pictures below:
Collecting the Data
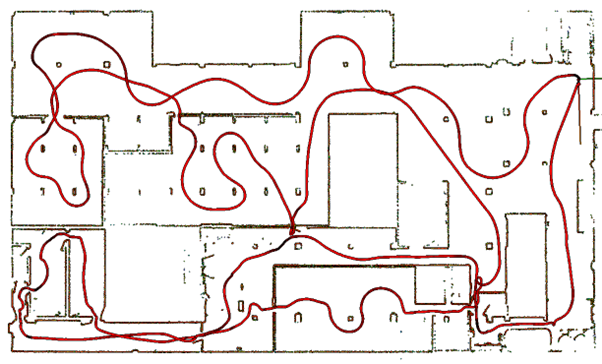
Three scans were carried out with the Elios 3 to capture LiDAR data for testing, all following the same approximate flight path to ensure consistency between the results.
All the scans started and ended in the same location, both for consistency and to ensure that the data capture loop was closed, as recommended. Best practice for SLAM data capture was maintained by performing loops within the capture and entering doorways sideways to ensure good visualization when moving into new environments.
The three scans had an average flight time of 8 minutes and 30 over a ~450 meters (1,476 feet) flight path. Datasets processed using FARO Connect averaged 108 million points per scan while datasets processed using FlyAware averaged 21 million points per scan.
Data Processing & Centroid Extraction
To ensure that the test was representative of what an end user can expect from the system, the GeoSLAM processing was carried out using the standard Flyability processing parameters found in FARO Connect. The data was not reprocessed by any other means, neither was it decimated nor filtered.
The FlyAware Live Model was processed onboard the Elios 3. It was neither reprocessed, filtered nor decimated.
As a post-processing step, an extraction tool* was run to identify the 15x targets in both the Elios 3 data and the TLS data. Once the targets were identified, the tool extracted the centroids of the targets to provide 15x centroids for both the Elios 3 and the TLS data. The centroids of the TLS data were used as Control Points and the Elios 3 centroids were used for comparison.
*Note: Some features may be different as this was initially tested with GeoSLAM Connect 2.1.1 and 2.3.0. GeoSLAM has since rebranded as FARO and FARO Connect.
Assessing Global Accuracy—Distance Measurements
To assess the global accuracy of the Elios 3, distance measurements were carried out and the Elios 3 data was compared against the TLS control data.
The steps carried out to complete the process were:
-
Distance measurements. The distance between a dispersed array of pairs of centroids was measured for both the control TLS data and the Elios 3 scans.
-
Find residuals. Residuals were found between the point pair distance of TLS data and the Elios 3 point pair distances.
-
Find RMSE. The RMSE (root mean square error) of the residuals was calculated for each distance from the residuals of the 3 scans.
-
Find the mean error. Finally, the average of the RMSE of the residuals was calculated.
The centroid pairs used to find the residuals and in turn the RMSE.
Results
The results from the global accuracy assessment of the Elios 3 data when processed using FlyAware yield a global accuracy RMSE of 18.3 cm (7.20 inches), while processing using FARO Connect produces a global accuracy RMSE of 3.5 cm (1.38 inches).
Comparing global accuracies produced by FlyAware and FARO Connect:
-
FARO Connect provides results which are 14.8 cm more accurate on average.
-
The higher RMSE from the Flyaware datasets can be predominantly attributed to the longer ranged point-point measurements (>~40 m), highlighting the effect of the cumulative accuracy decrease which can result from inherent system drift.
|
|
dXYZ Residuals |
|||
|
Tie Line |
Scan 1 |
Scan 2 |
Scan 3 |
RMSE |
|
TP01-TP08 |
0.262442628 |
0.296340977 |
0.167084387 |
0.248066725 |
|
TP02-TP07 |
0.399276419 |
0.474258956 |
0.293598156 |
0.39604002 |
|
TP04-TP08 |
0.244595845 |
0.271325485 |
0.165172459 |
0.231463883 |
|
TP05-TP14 |
0.164077752 |
0.161778041 |
0.009034386 |
0.1331356 |
|
TP07-TP09 |
0.304534955 |
0.089664317 |
0.186927971 |
0.212699549 |
|
TP11-TP12 |
0.044822093 |
0.019770349 |
0.010207113 |
0.028891013 |
|
TP14-TP15 |
0.028717208 |
0.040272922 |
0.026707821 |
0.032454552 |
|
|
|
|
RMSE |
0.183250192 |
Assessing Georeferenced Accuracy—Cloud-to-Cloud Alignment around Take-Off
In the previous section we discussed the global accuracy of the system. In this section we will assess the first registration method—cloud-to-cloud alignment around the take-off location.
Georeferenced accuracy assesses the global accuracy of the system as well as the accuracy of the georeferencing technique used.
To simulate a common use case for Elios 3 scans, the Elios 3 point cloud was aligned to the reference model around the take-off location. Doing this simulates the procedure that might be followed during a mission in an inaccessible area, in which Elios 3 is used to complete an existing georeferenced model and the control can only be placed at the flight’s starting location.
Only having control in one section of the scan environment causes any inaccuracies in the registration process to propagate throughout the scan and will result in increased inaccuracies as compared to using targets or ground control points (GCPs) across the whole scan.
To assess the cloud-to-cloud alignment accuracy of the Elios 3 using both FlyAware and FARO Connect, the following workflow was implemented:
-
A 15 meter (49.2 feet) section of the scan around the take-off location was used to perform cloud-to-cloud registration.
-
The 15 meter section of the TLS data was used as the reference and the 15m section of the Elios 3 data was aligned to the reference using cloud-to-cloud alignment. This alignment was then applied on the entire Elios 3 point cloud.
-
The reference centroids from the TLS data were recorded and compared to the aligned Elios 3 centroids.
-
The residuals between the reference centroids and the aligned centroids was calculated.
-
The RMSE for dXYZ for the 3x scans was computed for each reference point.
-
The average RMSE values for dXYZ were output.
-
The proportion of the RMSE compared to the distance was used to quantify % drift.
Results
The results from the georeferenced accuracy assessment of the Elios 3 data when processed using FlyAware yield an accuracy RMSE value of 64.9 cm (25.6 inches) with a drift of 1.41%.
Processing datasets using FARO Connect produced an accuracy RMSE of 11.0 cm (4.35 inches) with a drift of 0.19%.
Comparing global accuracies produced by FlyAware and FARO Connect:
-
FARO Connect provides results which are on average 53.9 cm more accurate.
-
Flyaware datasets can be expected to experience an 1.22% increase in drift.
-
Vertical drift is far less pronounced for FlyAware datasets. However, overall vertical residuals are still higher than observed in FARO datasets.
-
In both cases, much of the drift can be attributed to the registration method, where a large degree of rotation can be expected for both processing methods.
|
|
dXY Results |
|||||
|
Target |
Scan 1 |
Scan 2 |
Scan 3 |
RMSE |
|
|
|
TP001 |
0.049359 |
0.04199 |
0.034349 |
0.042345 |
|
|
|
TP002 |
0.040529 |
0.04021 |
0.032837 |
0.038025 |
|
|
|
TP003 |
0.058968 |
0.031769 |
0.041731 |
0.045563 |
|
|
|
TP004 |
0.026313 |
0.03242 |
0.034061 |
0.03111 |
Distance |
Drift |
|
TP005 |
0.407487 |
0.492586 |
0.361552 |
0.424031 |
45 |
0.94% |
|
TP006 |
0.767742 |
1.024275 |
0.701042 |
0.84262 |
56 |
1.50% |
|
TP007 |
0.758375 |
1.055128 |
0.722385 |
0.858345 |
50 |
1.72% |
| TP008
|
1.546672 |
1.920633 |
1.276418 |
1.60315 |
68 |
2.36% |
|
TP009 |
2.252747 |
2.427497 |
1.744062 |
2.160969 |
88 |
2.46% |
|
TP010 |
0.892565 |
1.155121 |
1.145422 |
1.071287 |
73 |
1.47% |
|
TP011 |
0.688044 |
0.945483 |
0.930786 |
0.862884 |
69 |
1.25% |
|
TP012 |
0.542971 |
0.827581 |
0.864152 |
0.75861 |
57 |
1.33% |
|
TP013 |
0.417983 |
0.498081 |
0.552083 |
0.492473 |
50 |
.98% |
|
TP014 |
0.214618 |
0.32831 |
0.34818 |
0.302808 |
35 |
.87% |
|
TP015 |
0.123919 |
0.227974 |
0.241153 |
0.204518 |
30 |
.68% |
|
|
|
|
MEAN RMSE |
0.649249 |
DRIFT |
1.41% |
Conclusion
The test results show that the Elios 3’s point clouds processed with FARO Connect produce high accuracy accuracies and lower drift compared with the point clouds processed using FlyAware.
On average, processing using FARO Connect improved global accuracy by 5.2 times compared to processing using FlyAware alone. By utilizing FARO Connect, the Elios 3 is able to meet survey requirements with minimal system accuracy of 35 mm (1.38 inches). Although the Live Model provides users with a real-time visualisation of the environment for navigation, route planning, and scan coverage verification, the average accuracy of 182 mm (7.2 inches) does not make it fit for these applications.
The Cloud-to-Cloud assessment shows how the Elios 3 can easily be implemented to both map and georeference inaccessible environments. In these use cases the effect of drift is most pronounced as the accuracy is constrained by the distance to/from and distribution between points in the reference frame.
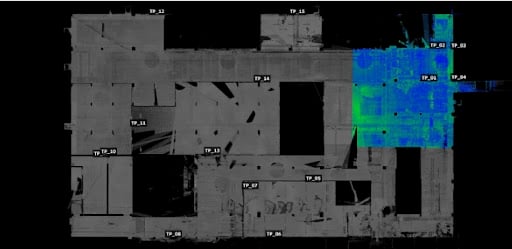
Looking at the Georeferenced accuracies, point clouds processed using FARO Connect were 5.9 times more accurate than those processed using Flyaware. This can be attributed to the higher system drift accumulated during FlyAware processing, in which drift was 7.42 times the value produced by FARO Connect.
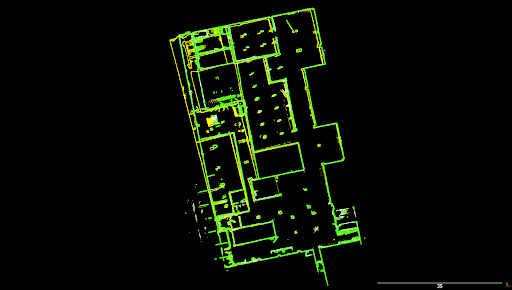
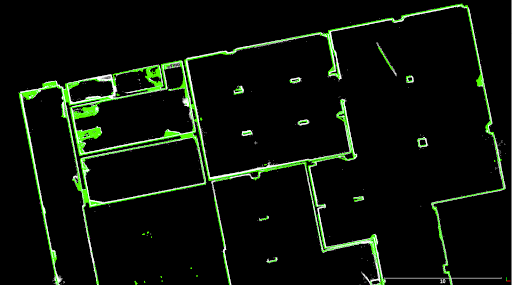
This can be clearly observed in the horizontal offset between the FlyAware point clouds and the TLS control at distances of over 75m from the take-off location.
-
Green = Riegl VZ400 TLS Control.
-
White = Elios 3 point cloud processed using FARO Connect.
-
Yellow = Elios 3 point cloud processed using FlyAware.
-
Green = Riegl VZ400 TLS Control.
-
White = Elios 3 point cloud processed using FARO Connect.
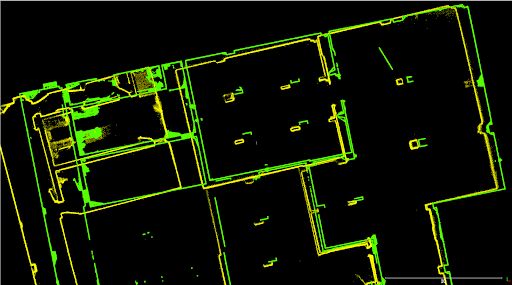
-
Green = Riegl VZ400 TLS Control.
-
Yellow = Elios 3 point cloud processed using FlyAware.